Grades OV is an academic utility built around a simple student question: “What do I need on the work that is left?”
Most grade calculators answer a narrower version of that question. They total the grades already entered, maybe apply category weights, and stop there. The calculator in this project goes further. When a student enters a target grade, it finds a possible set of scores for the blank upcoming assignments. Under the hood, that prediction is a small linear programming problem solved in the browser.
The calculator has two related jobs:
The first job walks through courses, categories, and assignment entries, then computes earned points divided by possible points. Dropped entries are ignored when counting earned points, and blank entries are treated carefully so they do not accidentally turn into zeroes.
The second job runs outside the main interface thread. It receives the current course state, formulates a linear programming problem, finds a feasible answer, and returns predictions as placeholders on blank assignments.
That last detail matters: predicted values are not written as real grades. They are displayed as guidance.
The data model is intentionally small:
points, maxPoints, name, and dropped.maxPoints, which acts as the category’s total point budget or weight depending on the course mode.In points mode, an assignment might be worth 18 / 20. In percent mode, the UI displays percent scores, but the internal data still stores points so the same calculation service can be reused.
Incomplete courses require one additional assumption. If a category has a total of 100 points but only 70 points are assigned to known entries, the calculator distributes the remaining 30 points across its blank entries. This gives the model a reasonable estimate of future-assignment weights when an instructor has not yet filled in every detail.
When the student chooses a letter-grade goal or enters a custom target, the calculator converts it to a numeric course-grade target.
Before the optimization runs, the calculator subtracts the contribution of work already graded. For every filled entry, it computes how much that score already contributes to the final course total:
remaining goal =
  target grade - contribution from already completed assignments
Only blank assignments become variables in the model. Completed work is evidence; blank work is what the model can plan around. Each remaining entry contributes a proportional course weight, while its identity is retained so a prediction can be displayed in the correct row without being stored as a real grade.
The remaining assignments form a vector of unknown percentage scores:
x = [x₁, x₂, ..., xₙ]ᵀ
Their contribution to the final course grade is described by a weight vector:
w = [w₁, w₂, ..., wₙ]ᵀ
Each weight represents how much one percentage point on an assignment changes the overall course grade. If r is the portion of the target still needed after completed work is counted, the planning question becomes:
wᵀx = r
This is a dot product: every predicted score is multiplied by its course weight, and the contributions must sum to the remaining goal. Each score is also bounded by the natural range of a grade:
0 ≤ xᵢ ≤ 100
for every remaining assignment. If no vector x can satisfy both the weighted equation and those bounds, the selected target is unreachable under the known course structure. The calculator then says so instead of presenting an unrealistic plan.
The browser-side model is a direct translation of that equation.
type RemainingAssignment = { id: string; weight: number };

function solveForTarget(
  assignments: RemainingAssignment[],
  remainingGoal: number,
) {
  const constraints: Record<string, { min: number; max: number }> = {
    target: { min: remainingGoal, max: remainingGoal },
  };
  const variables: Record<string, Record<string, number>> = {};

  for (const { id, weight } of assignments) {
    constraints[id] = { min: 0, max: 100 };
    variables[id] = {
      target: weight, // contributes wᵢxᵢ to the target equation
      [id]: 1, // applies the 0–100 score bound to this variable
      feasibility: 0,
    };
  }

  return solver.Solve({
    optimize: "feasibility",
    opType: "min",
    constraints,
    variables,
  });
}
The target coefficients form the weight vector w; the solver chooses the score vector x. Setting both the minimum and maximum target to remainingGoal turns the dot product into an equality rather than a loose threshold.
When more than one assignment remains, the equation usually has many solutions. Two future assignments can support the same target through a wide range of score combinations. Linear programming provides a principled way to select one feasible plan while respecting score bounds and assignment weights.
The model can also prefer balanced guidance rather than treating a small homework assignment exactly like a major exam. The final recommendation is still constrained by the same weighted-grade equation; the optimization only chooses among valid solutions.
The solved vector returns to the interface and is converted into the appropriate display format. In percent mode, each value can be shown directly. In points mode, it is converted back into points:
predicted points = assignment max points * predicted percent / 100
Each prediction is displayed beside its matching blank entry as guidance, without changing the student’s actual grade record.
Imagine a student has already earned 50 percentage points of final-grade contribution and wants to finish the course with an 80. Three pieces of work remain: homework worth 5% of the final grade, a quiz worth 15%, and an exam worth 20%. The remaining work must contribute 30 more percentage points.
Let h, q, and e be the needed percentage scores on the homework, quiz, and exam. The course requirement becomes:
0.05h + 0.15q + 0.20e = 30
There is no single mathematical answer. For example, an even plan is feasible:
h = 75, q = 75, e = 75
But so is a plan that puts more of the burden on the earlier work:
h = 90, q = 80, e = 67.5
Both plans satisfy the same weighted equation and the same score bounds. With three remaining variables and one target equation, the feasible answers form a set rather than a single point. In general, each additional remaining assignment gives the planner another way to distribute the required contribution.
That is why the optimization step matters. “Right” is not a purely mathematical answer; it means selecting a useful recommendation from the feasible set. The calculator prefers balanced guidance while accounting for the relative importance of each assignment, rather than arbitrarily returning the first valid combination or requiring a perfect score on a small piece of work.
The nice thing about linear programming is that the calculator can explain itself. There is no machine-learning model to train, no hidden prediction data, and no personal academic history required. The solver is answering a constrained planning question:
Given the work already completed, the weight of the work left, and a target course grade, what blank scores would make the target mathematically possible?
That makes the result useful in two ways. If the target is feasible, the student gets a concrete plan. If it is infeasible, the student learns that the current target cannot be reached under the known course structure.
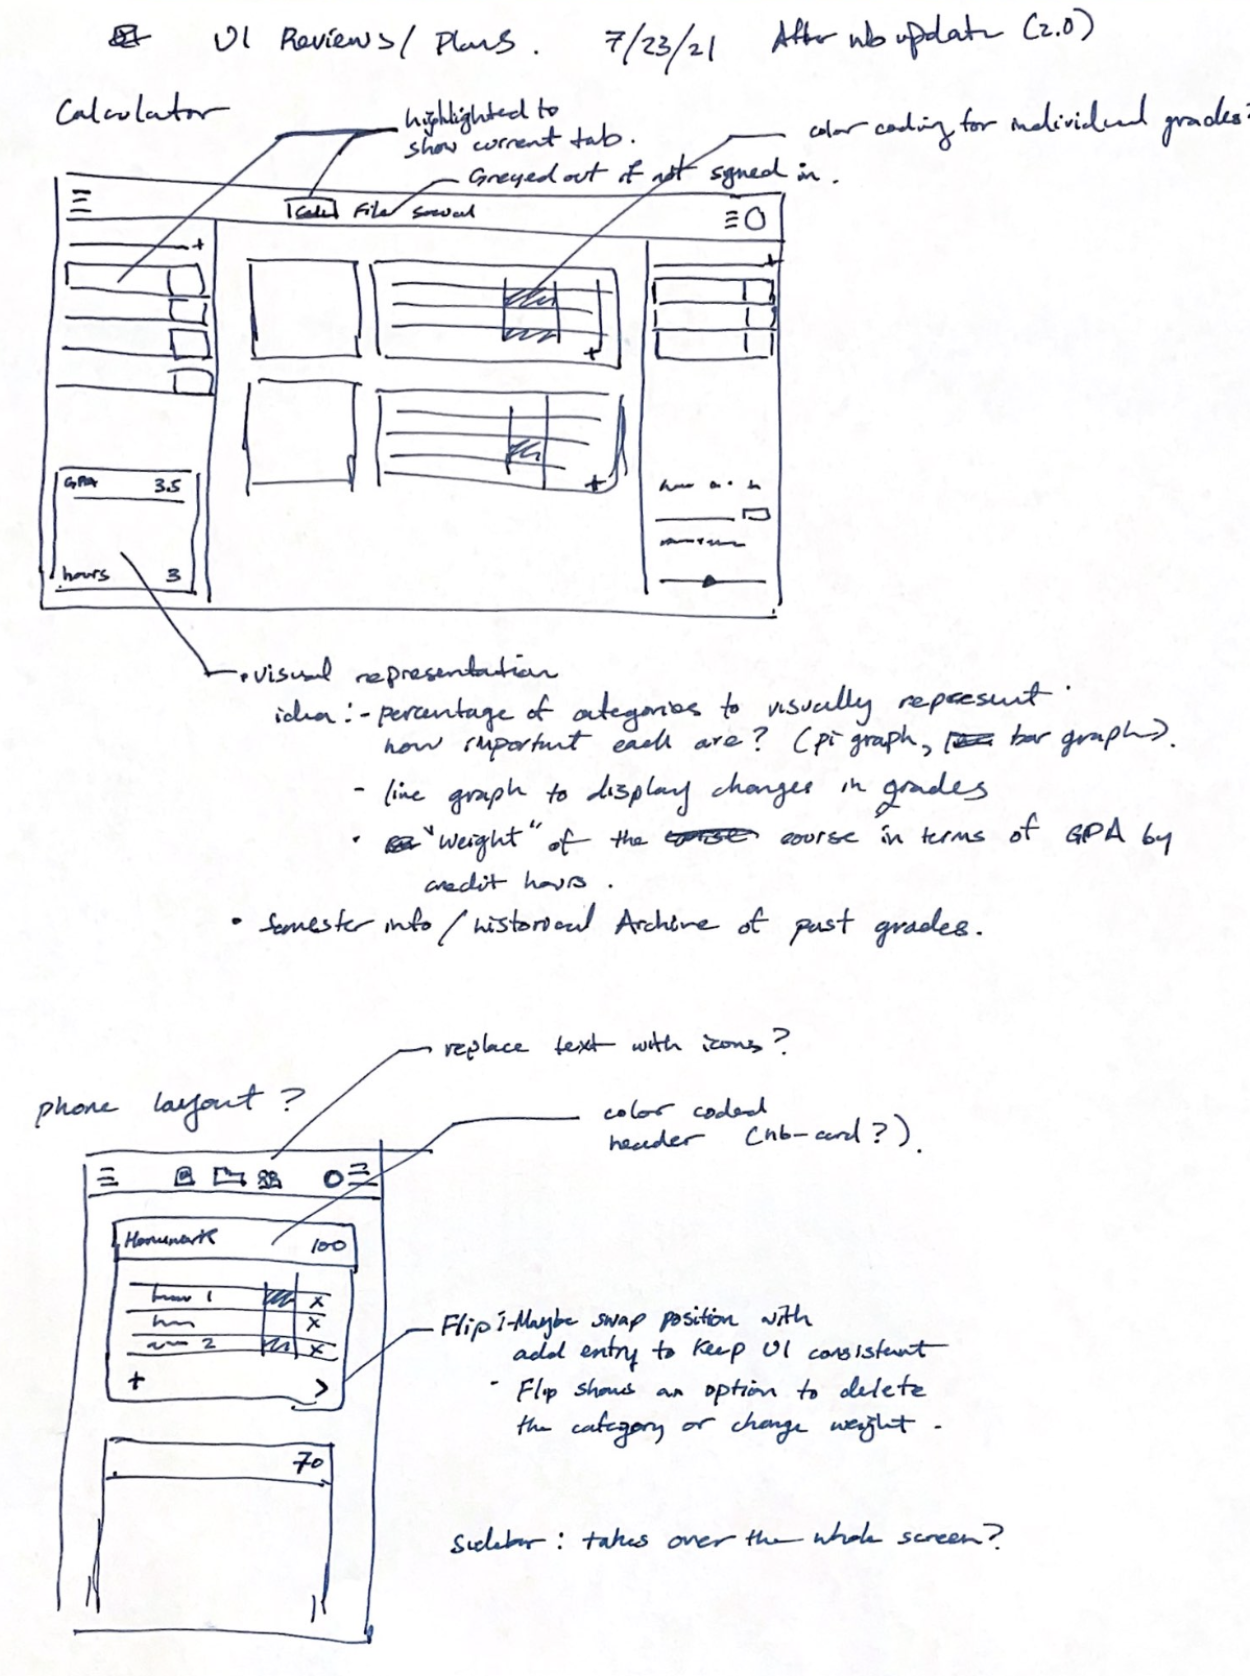
Early Design Concept
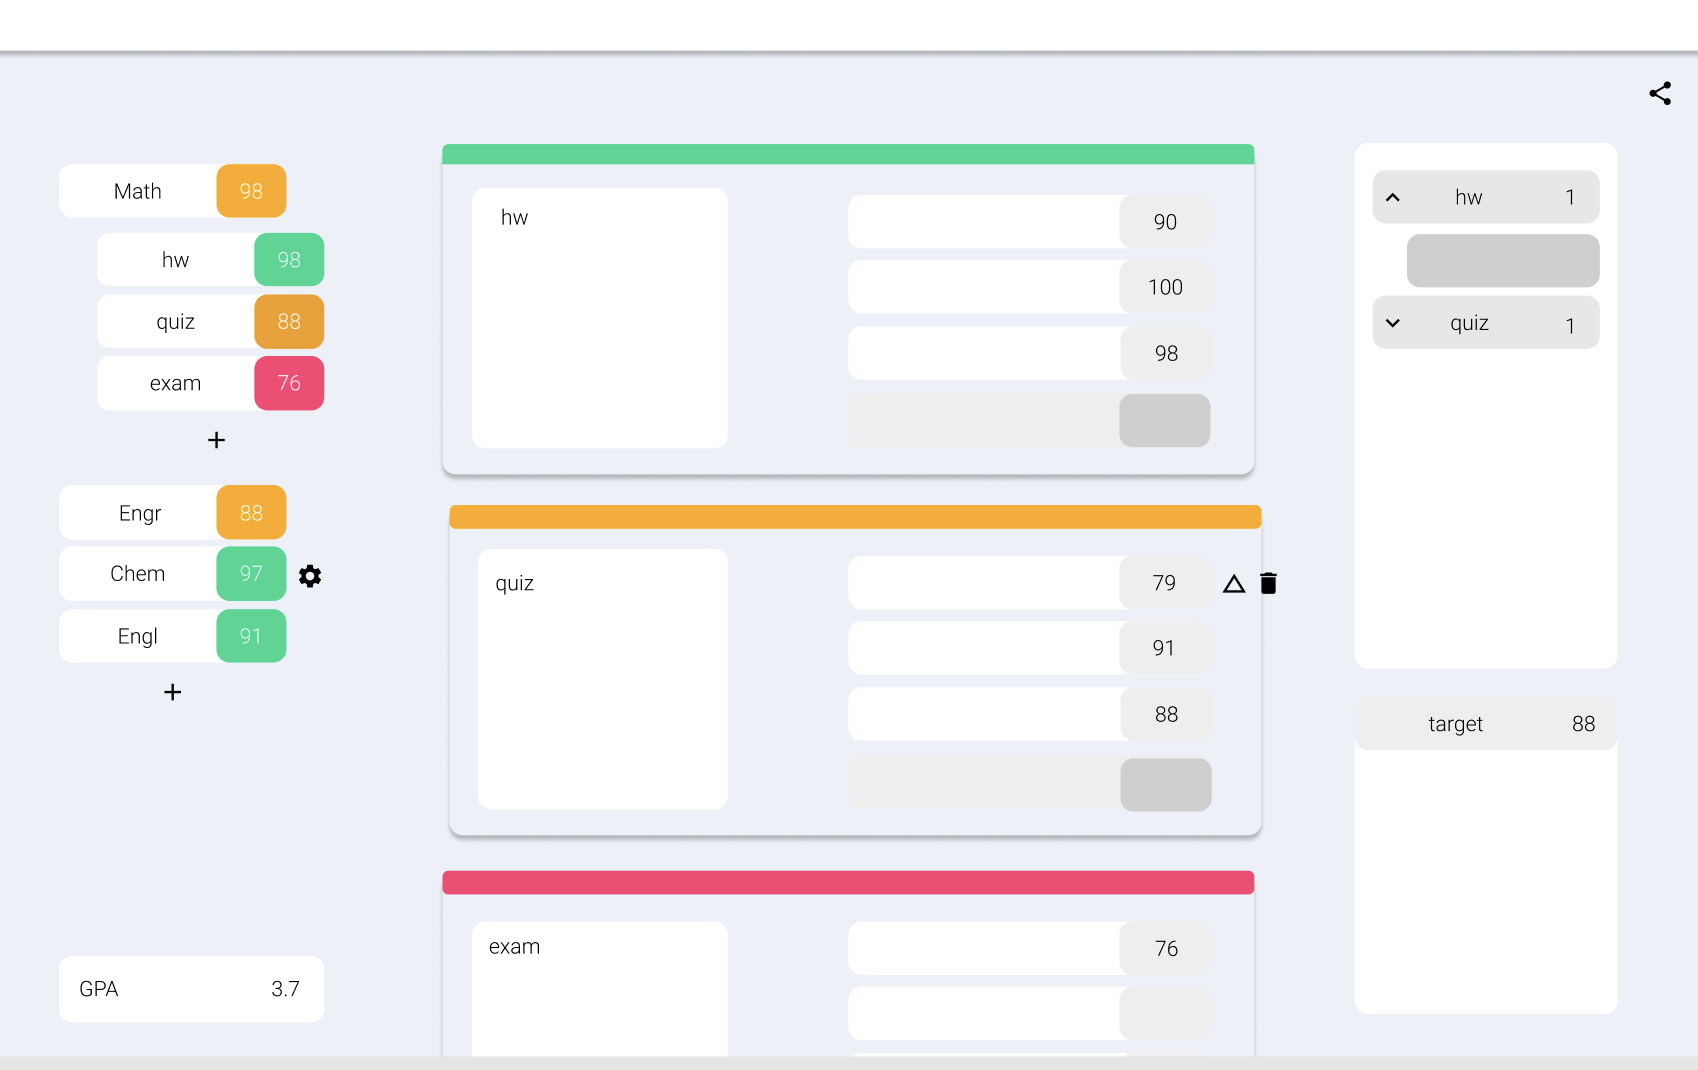
Figma Prototype
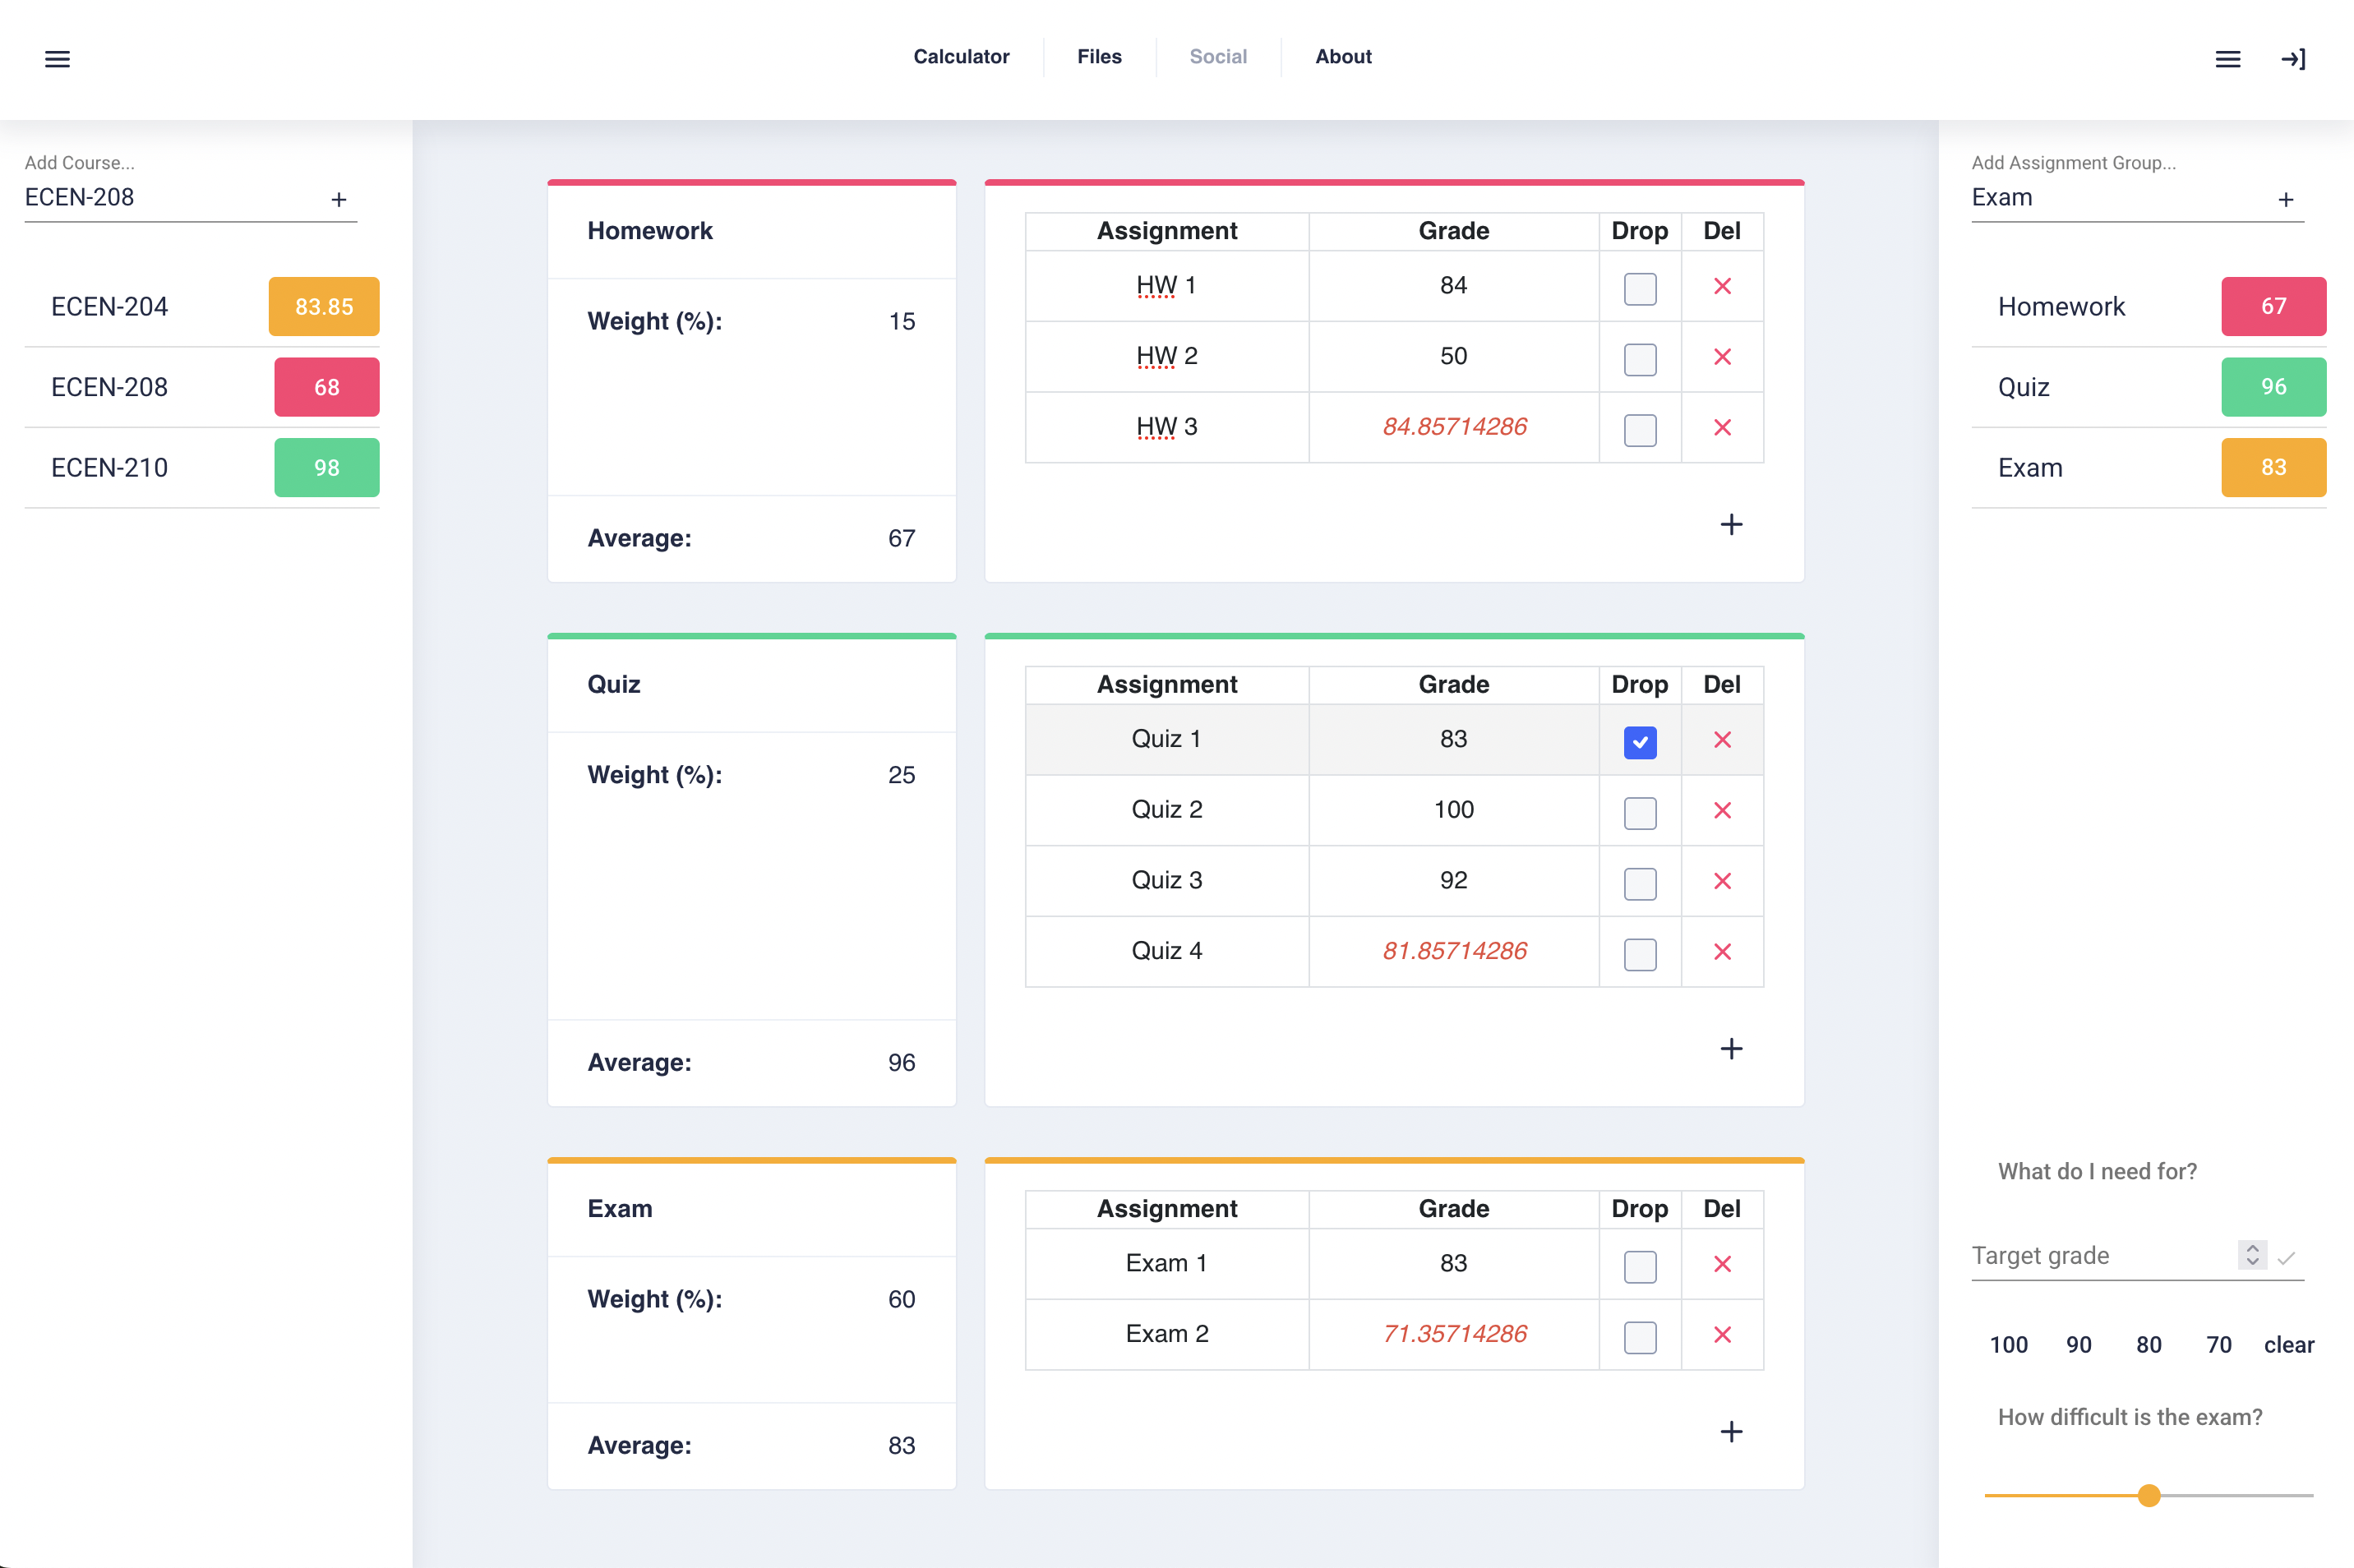
The website UI:
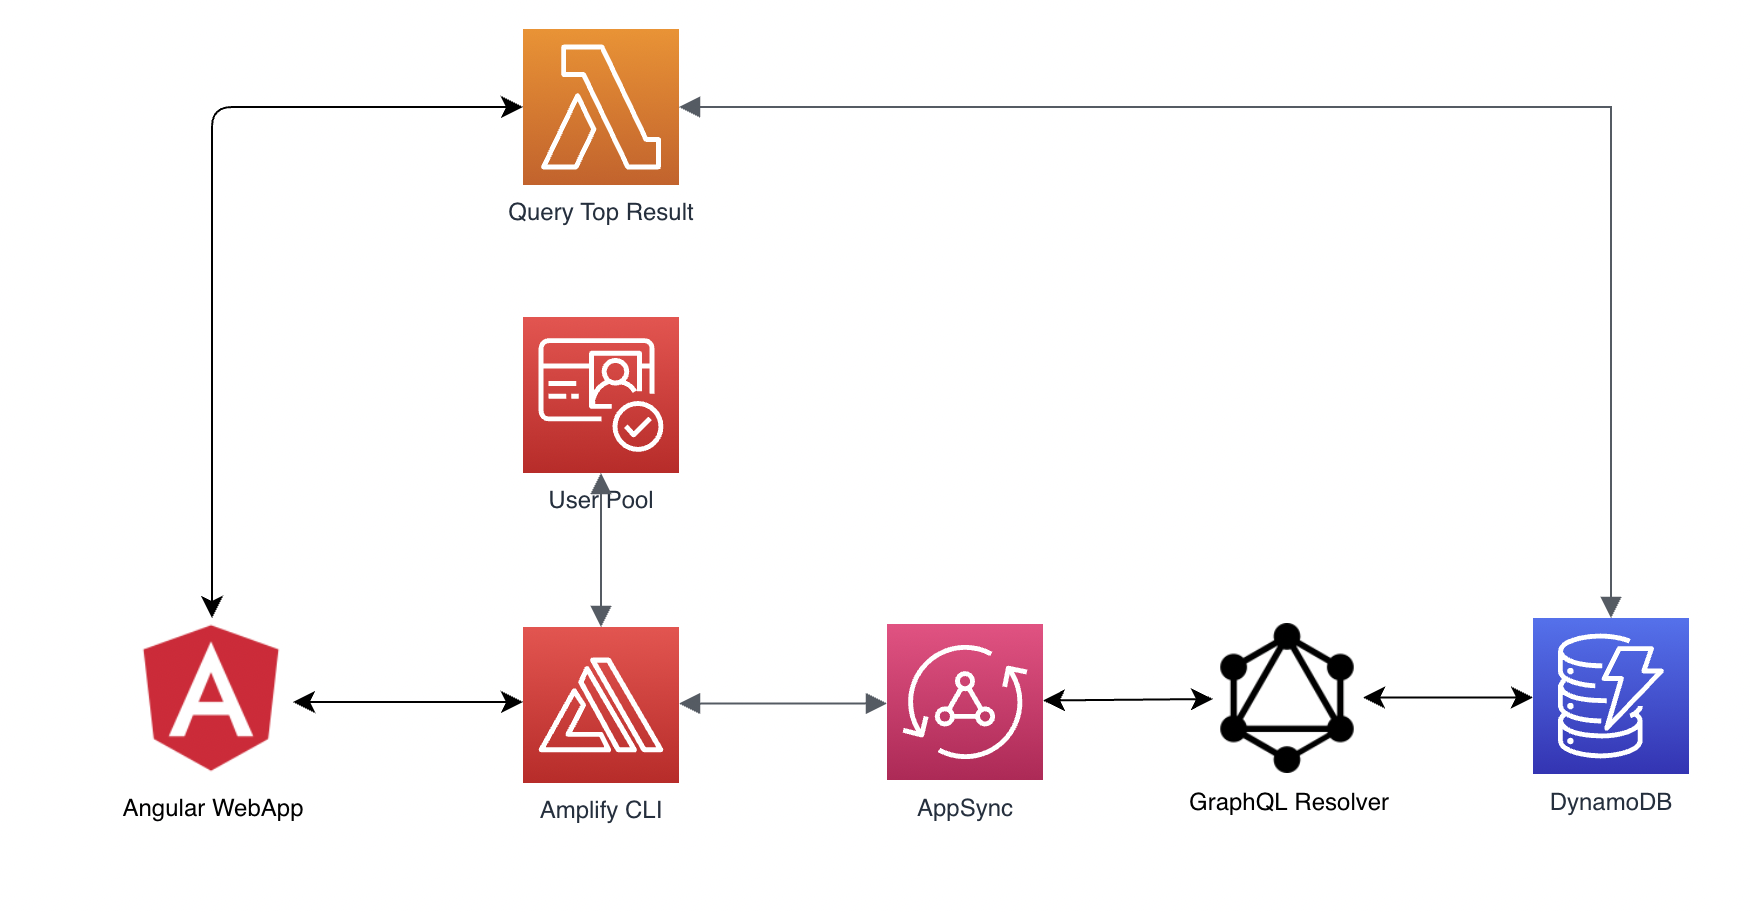
The first deployment direction was AWS Amplify. That made sense for an Angular project and offered a flexible cloud model, but the surrounding services introduced more operational weight than the project needed at that stage. Cognito made persistent auth state in Angular difficult to set up and monitor, AppSync introduced a new GraphQL schema layer to maintain, and DynamoDB added another integration surface.
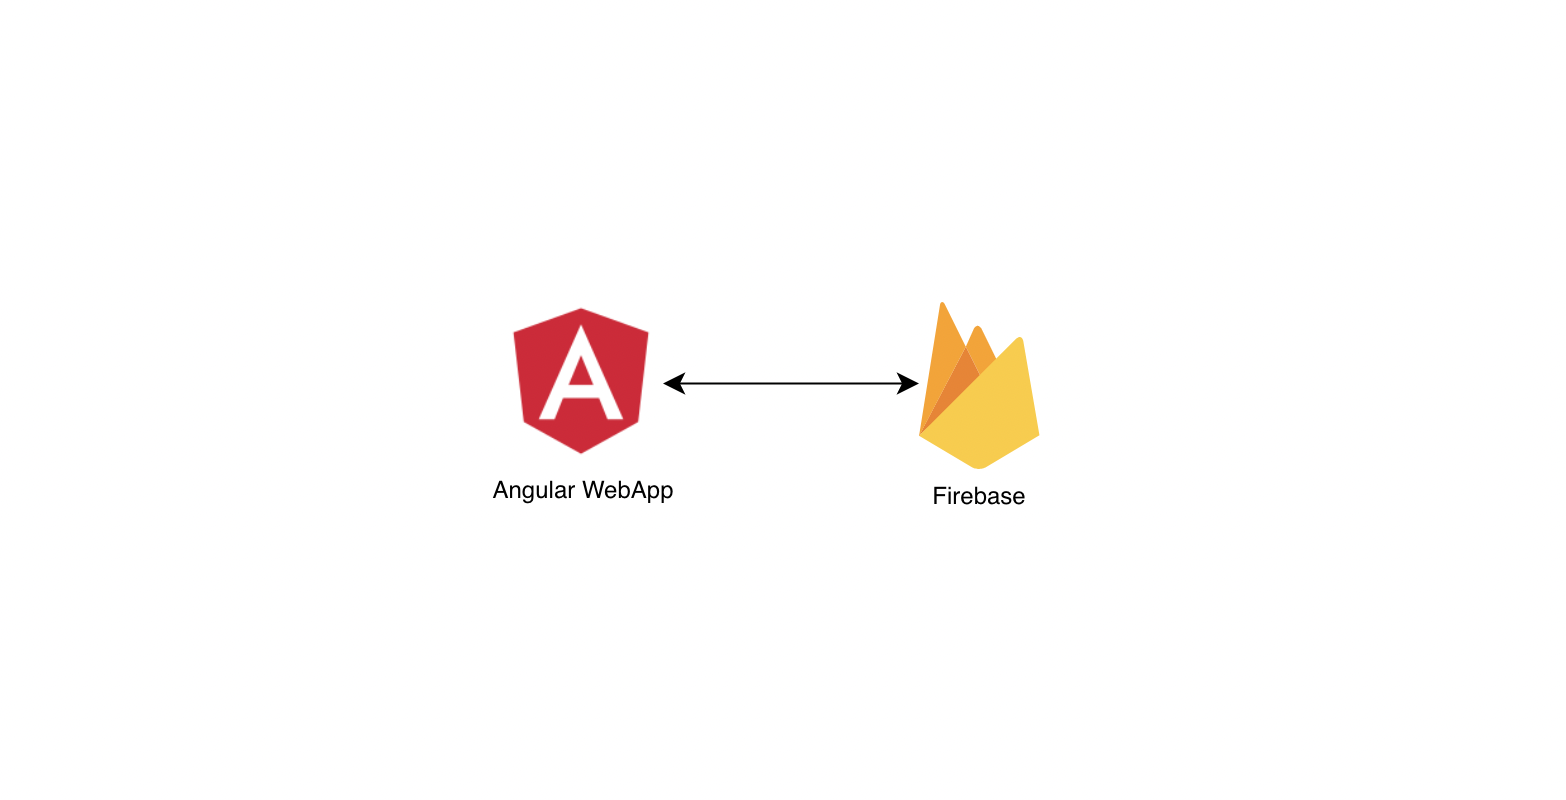
The project eventually moved to Google Firebase because it fit the shape of the product better. Firebase Authentication handled user identity with less custom infrastructure, and Cloud Firestore gave the app a low-maintenance database for course, category, and grade data. That tradeoff mattered: the product could spend more energy on student-facing behavior like grade prediction instead of backend plumbing.
The infrastructure writeup frames the move visually as a shift from a more granular AWS architecture to a simpler Firebase-backed architecture:
From:
 To:
To:
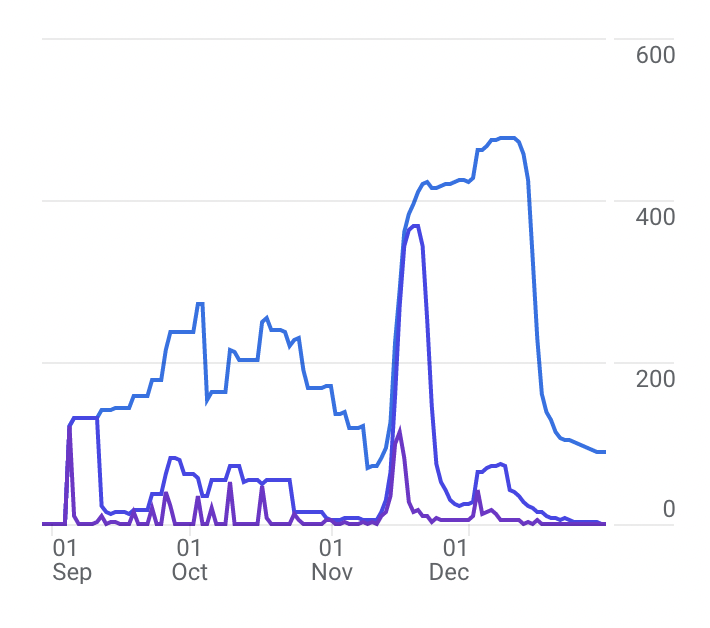
After deployment, Grades OV reached a peak of 477 users in a month during university finals.
This calculator is a good example of using optimization in a friendly, student-facing way. It does not try to predict the future from past behavior. Instead, it translates a student’s goal into a math problem:
current progress + weighted future scores = target grade
Then it lets a linear programming solver find a feasible set of upcoming scores. The result is practical, transparent, and fast enough to run in the browser while the student is editing their course plan.
The website is now down as due to maintainence cost but the working model can be found here: https://github.com/wjdpark/colligs